Month: December 2009
Brede Wiki and Brede Database 2009
I have just drafted a section for the CIMBI 2009 annual report:
We have argued for a wiki approach to database information from published neuroimaging articles [1], and we now have implemented the Brede Wiki available from the Web site http://neuro.imm.dtu.dk/wiki/
The wiki is based on MediaWiki – the software that runs Wikipedia. With an extensive use of so-called MediaWiki templates information can be structured and easily extracted [2]. The content in the wiki is focused on neuroscience information: Text and data about neuroimaging studies, brain regions, topics, software, researchers, organizations, journals and events. The wiki makes extensive use of deep links to other neuroscience databases, enabling federation of content with other neuroinformatics databases. The Brede Wiki has almost 1,500 pages, e.g., describing 206 brain regions and 175 scientific papers. With the extracted data from the structured part of the Brede Wiki a small search interface has been constructed that allows for searching for nearby coordinates to a given query coordinate. The Brede Wiki also allows for upload of volume files in a standardized format. Thus it provides a uncomplicated means for sharing result volumes from neuroimaging statistical analyses.
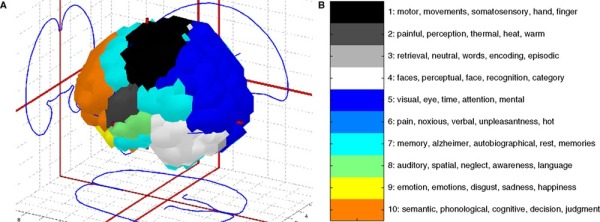
Another project of the group – Brede Database – has now been included in the large scale American database federation effort ‘Neuroscience Information Framework‘. Furthermore some of the visualization efforts for the Brede Database was described in a recent article [3].
- Lost in localization: A solution with neuroinformatics 2.0? Finn Årup Nielsen, NeuroImage, 48:11-13, 2009
- Brede Wiki: Neuroscience data structured in a wiki, Finn Årup Nielsen, Proceedings of the Fourth Workshop on Semantic Wikis – The Semantic Wiki Web : 6th European Semantic Web Conference, Hersonissos, Crete, Greece, June 2009: Lange, Christoph
- Visualizing data mining results with the Brede tools, Finn Årup Nielsen, Frontiers in Neuroinformatics, 3:26, 2009.
The image is a figure from the CC-by Frontiers in Neuroinformatics article
Temporal COP15 sentiment analysis
I finally managed to construct a plot of the temporal evolution of sentiments in relation to COP15 tweets. As I have written before we are presently downloading posting from Twitter based on a query on COP15 — the United Nations Climate Change Conference held here in Copenhagen. So far we have over 70’000 individual COP15 tweets. Each of these tweets is automatically scored for valence within our simple sentiment analysis, and by joining the valence of each tweet to its date a plot can be made which shows the number of positive and negative COP15 each day — with neutral postings excluded. Not surpricing there is an increase in posts as we got nearer and nearer to the opening with a present peak the day that COP15 began: Monday 7 December. The ratio between positive and negative tweets is not that varying over time. The weekend has a low number of postings.
The tweets are stored in a SQLite. I am not so familiar with the SQL database query language, and so far the best SQL I could construct to count the positive and negative tweets per day looks like this:SELECT * FROM (SELECT strftime('%Y-%m-%d', created_at) AS timestamp_positive, COUNT(*) FROM tweets, tweets_sentiment WHERE query LIKE 'cop15' AND tweets.id = tweets_sentiment.id AND valence > 2 AND ambivalence < 3 GROUP BY timestamp_positive JOIN (SELECT strftime('%Y-%m-%d', created_at) AS timestamp_negative, COUNT(*) FROM tweets, tweets_sentiment WHERE query LIKE 'cop15' AND tweets.id = tweets_sentiment.id AND valence < -2 AND ambivalence < 3 GROUP BY timestamp_negative) ON timestamp_positive = timestamp_negative;
I guess there might be a more effective way than this statement, since (as far as I can determine) the SQL is running more than one time over all tweets.
COP15 opening music sentiments
COP15 is opening and I have seen a not surpricing increase in the number of tweets on the COP15 sentiment analysis presented on our Web site. You can even see reactions to individual events, such as the music of Palle Mikkelborg and Danish National Girls’ Choir. Thus Oslo-based Raymond Kristiansen writes
the trumpet solo after that pathos-filled movie of a little girl and her father worrying about climate change – awful #cop15
Awful? Hmmm…. Cairo-based science journalist Mohammed Yahia has the contrary view and writes
Very beautiful presentation right now by the Girls Choir of Denmark as part of the cultural events before the #COP15 opening speech
"A little dry ice break… Sections look good!" Online real-time neuroscience.
As I write neuroscientists at the University of California, San Diego are trying to slice the brain of the second most famous neurological patient: HM. That is pretty remarkable.
But what is also quite remarkable is that the slicing with dry ice and microtome is being transmitted live via the Internet and three video cameras: one for the moving slicer, one for each console and and one with and overview of the lab. You can follow the slow progress through the coronal slices. The lab got their own Facebook group, their Project HM blog, online donation form and “coming soon” on Twitter. During the video twitters post under the #HM tag. I got to know from Maria Page — one of the 39 twitters I follow… This is really real-time Neuroscience 2.0! I think this road is where science is moving: more online, more 2.0. Here you get to see the nitty gritty details: “A little dry ice break…” And I didn’t know their used a brush to take off the cut slice from the knife. And by the way it is also mentioned in “old” media. At section #814.

